If you have been running Google Performance Max (PMax) campaigns lately, there is a new tool in your reporting dashboard that could save you both money and headaches. Google Adds Cost Per Channel View to PMax: a Cost Slider that lets you see exactly how much of your campaign budget each channel is consuming.
It sounds simple, but for marketers who have been asking for more transparency in Performance Max for years, this is a big deal. Start building hashtag campaigns that actually work.
Google Adds Cost Per Channel View to PMax
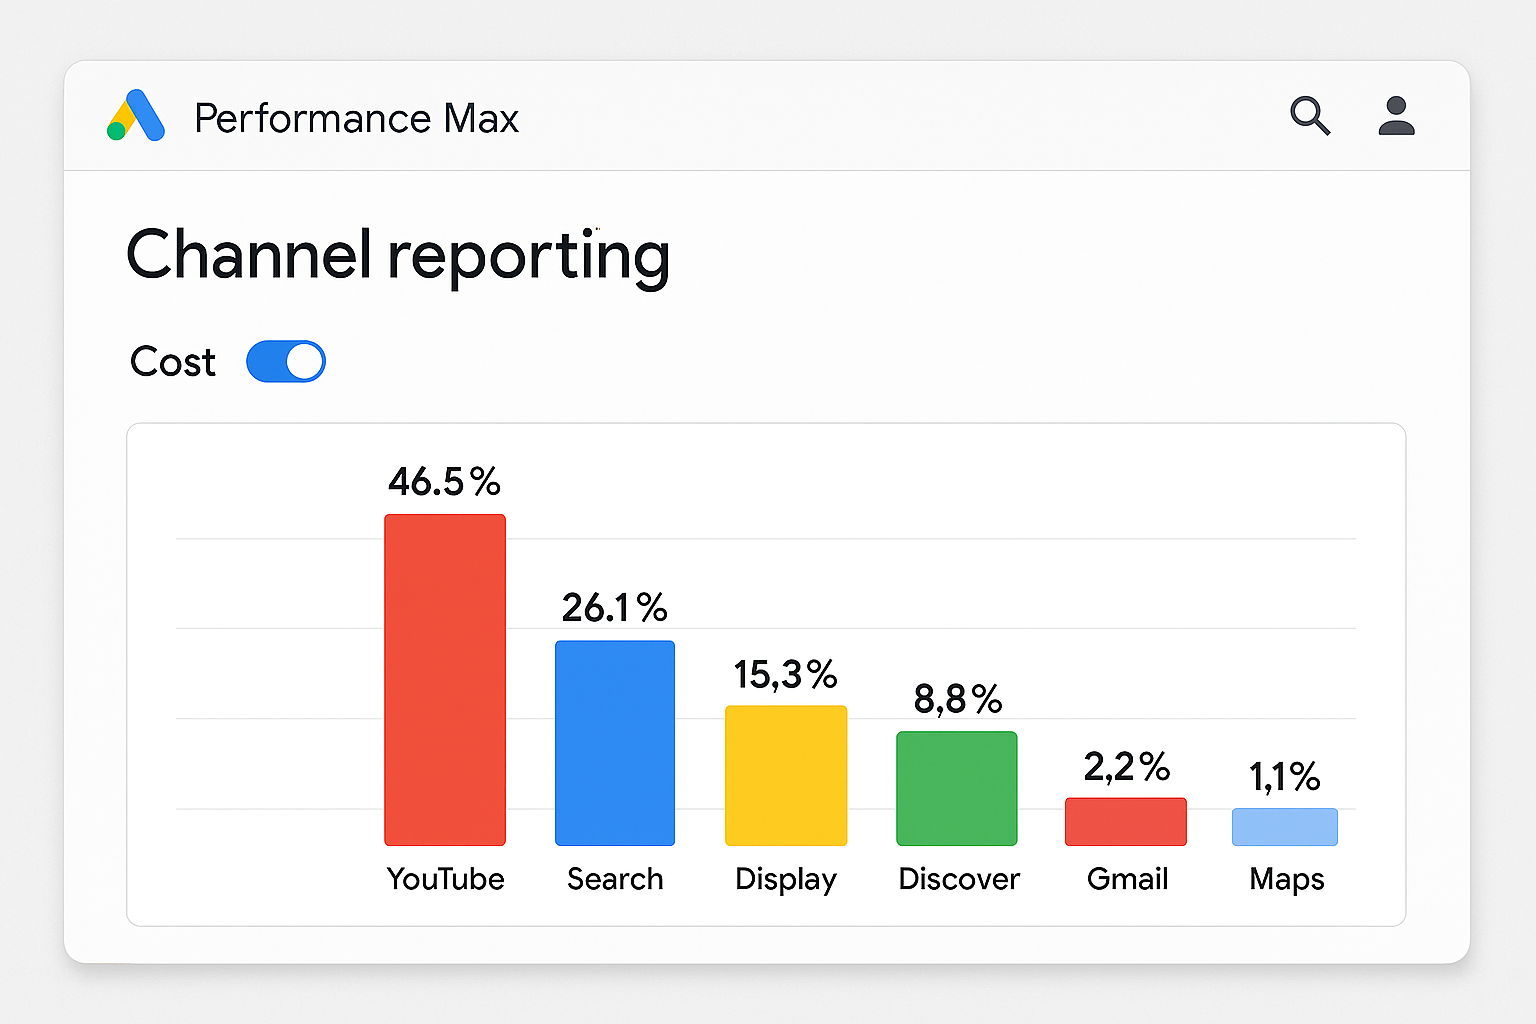
The PMax Channel Reporting beta now includes a new toggle option. When you turn on the Cost Slider, it will display the percentage of your total campaign spend going to each Google network or channel within your Performance Max campaign.
This means you can now see, in an instant, which placements are eating up your ad budget. Whether it is YouTube, Search, Display, Discover, Gmail, or Maps, you will know exactly where your money is going.
Before this update, you could see performance metrics for different channels but not a clear breakdown of spend as a percentage of your total budget. You were essentially guessing how much each channel was costing you unless you tried to reverse-engineer it through other data.
Why This Matters for Marketers
I have been running PMax campaigns for clients since the format first launched, and one of the biggest frustrations has always been the lack of granular budget control. While Performance Max is designed to use Google’s AI to find the best conversions across all channels, it also means you are giving up the ability to manually allocate your budget.
The new Cost Slider does not let you set budgets for each channel (yet), but it does give you transparency. And transparency is the first step toward optimization. Find out what the Instagram chief really said about engagement.
If you can see that YouTube is eating 40 percent of your budget but is driving very few conversions, you can make data-backed decisions. You might adjust your creative, change targeting signals, or even split campaigns to separate high and low performing channels.
On the flip side, if you see that Search is only taking 20 percent of your budget but delivering a much higher return on ad spend (ROAS), that is a clear sign you might want to find ways to push more budget toward it, either by restructuring campaigns or using complementary search campaigns.
How It Works in Practice
Imagine you are running a PMax campaign with a daily budget of $500. After toggling on the Cost Slider, you discover the breakdown looks like this:
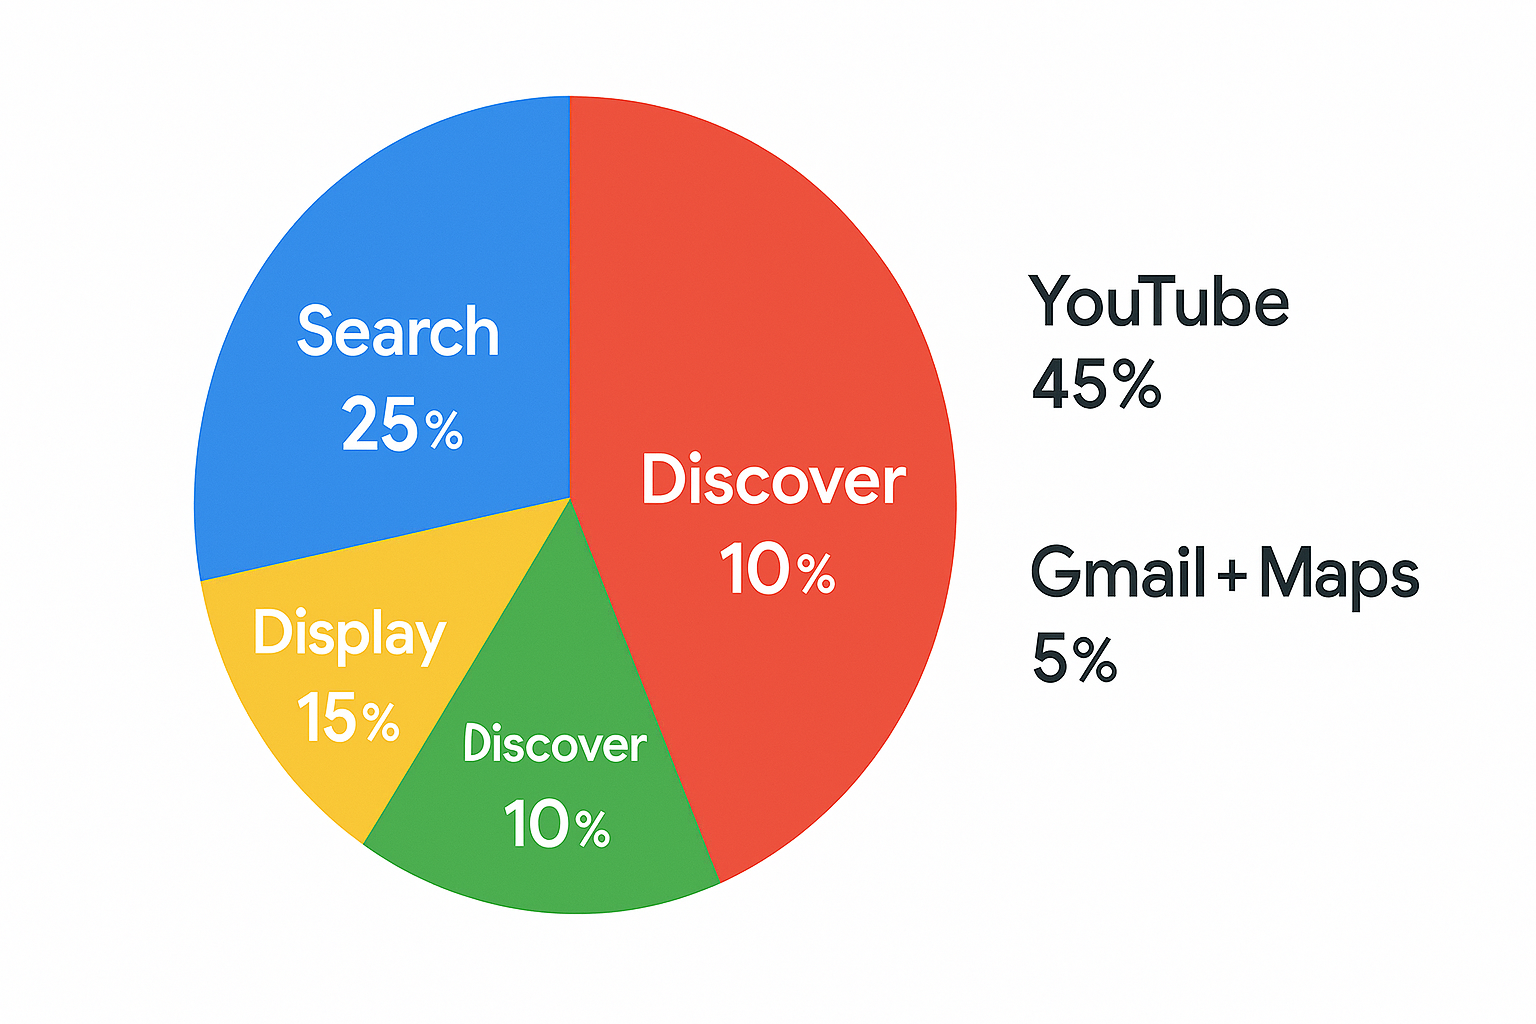
- YouTube: 45 percent of spend
- Search: 25 percent of spend
- Display: 15 percent of spend
- Discover: 10 percent of spend
- Gmail and Maps: 5 percent of spend combined
Now you know that almost half of your budget is going toward YouTube. If your YouTube video ads are not converting well, you can either work on improving those creatives or find a way to reduce that allocation through campaign adjustments.
On the other hand, if YouTube is your top-performing channel in terms of conversions, you now have the confidence to scale it further. See how fresh content affects your SEO with the Content Freshness Impact Calculator.
A Shift Toward More Transparency in PMax
When Performance Max first came out, many advertisers were frustrated by its “black box” nature. The campaign type pooled all your assets and budget into one big machine learning system, then decided where to show your ads.
It worked for some, but for many advertisers, the lack of control made it risky. You might find most of your budget going to low-intent placements, with little you could do about it.
Over time, Google has slowly added more transparency features. First, we got channel-level performance reporting. Then we saw asset group reporting improvements. Now, with the Cost Slider, we have a clearer picture of budget allocation.
It might still be far from having full manual control, but for marketers who thrive on data, every new insight is a step forward.
Benefits of the Cost Slider
Here are some clear wins that come from using this new feature:
- Identify overspending channels: Quickly spot which networks are getting too much budget compared to their performance.
- Uncover scaling opportunities: If a channel is performing well but getting a small slice of the spend, you can look for ways to feed it more budget.
- Better creative and asset decisions: Knowing where your budget is going helps you decide where to invest in new creatives or refine messaging.
- More informed client reporting: For agencies, this is huge. You can now show clients exactly where their money is being spent without guesswork.
What This Means for Campaign Strategy
If you are a hands-on marketer, the new Cost Slider is a diagnostic tool. It helps you answer questions like:
- Are my high-performing channels underfunded?
- Is too much of my budget going to awareness placements instead of conversion-focused ones?
- Should I break my PMax into separate campaigns to isolate better-performing channels?
In some cases, the answer might be to simply improve underperforming channels. In other cases, it might make sense to split them into different campaigns for more control.
For example, if YouTube keeps taking up a large portion of the budget but conversions are low, you might launch a dedicated YouTube campaign with its own targeting, while keeping PMax focused on search-heavy signals.
The Beta Rollout and Access
This feature is still in beta, which means not all accounts will have it yet. If you do not see the Cost Slider in your PMax Channel Reporting, keep an eye on your Google Ads interface over the next few weeks.
As with many Google betas, it is likely rolling out gradually. If you manage multiple accounts, you might see it appear in one account before another.
A Personal Take as a Marketer
From my perspective, this is one of those updates that feels small at first glance but can make a big impact over time. The more data you have, the better your decisions will be.
When I ran my first PMax campaign, I remember being shocked at how much budget went into YouTube without me realizing it. If I had this Cost Slider back then, I would have caught it in week one and made changes immediately. Uncover hidden issues with the Cart Data Diagnostics Tool.
Performance Max is still not perfect, but updates like this show Google is listening to feedback. Marketers want automation, but they also want visibility. This is a step toward balancing those two needs.
Final Thoughts
The Google Adds Cost Per Channel View to PMax may not give us full budget control yet, but it gives us something almost as valuable: insight.
By seeing the percentage of spend per channel, advertisers can finally stop guessing where their money is going and start making smarter, more targeted decisions.
For anyone serious about running profitable Performance Max campaigns, this is a feature worth checking daily.
If you already have it in your account, turn it on and take a look at your budget distribution. You might be surprised at what you find.
